Volume vs price
Revenue movement needed to be separated into quantity and pricing effects by product rather than reported as one headline value.
FEATURED CASE STUDY 04 · SALES & COMMERCIAL
An operational commercial reporting system originally built in Excel/VBA for cement sales, pricing, customer, credit and market analysis, with selected analytical views later rebuilt in Power BI as a modernization exercise.
CONTEXT & ORIGIN
The original solution was a multi-sheet Excel/VBA system built around day-to-day commercial reporting. Its workbook connects sales, credits, dispatch, products, customers, market areas and budget references into dedicated analytical views.
VBA-driven dropdowns and linked reporting sheets gave users a practical way to move between product and market analysis, credit and sales views, customer transaction cards, top-customer rankings and accumulated product analysis.
THE COMMERCIAL PROBLEM
Commercial performance sits at the intersection of quantity, price, product mix, market mix, customer activity, incentives, freight and credit. The reporting system had to keep those drivers connected.
Revenue movement needed to be separated into quantity and pricing effects by product rather than reported as one headline value.
Actual performance needed a clear reference against budget and prior-year positions to make variance meaningful.
Sales contribution, credit, debit balance, incentives and transaction history needed to be visible at customer level.
Management needed to see where volume was concentrated across products, markets and delivery areas.
SYSTEM EVOLUTION
The Power BI version was not presented as the original operating system. It was a later reinterpretation of the same business domain using a modern analytical model.
ORIGINAL · EXCEL / VBA
LATER · POWER BI
COMMERCIAL ANALYTICS ARCHITECTURE
Both generations of the system follow the same path: connect the underlying commercial records, calculate the business measures and expose the relationships management actually needs to see.
01 · SOURCE DATA
02 · COMMERCIAL LOGIC
Connect quantity, pricing, customer, product, incentive, freight and credit measures around consistent reporting periods.
03 · COMPARISON
Separate the drivers of change, then compare products, customers and markets against the relevant commercial reference.
04 · REVIEW OUTPUT
Management summaries, customer-level detail, product performance, market distribution and exception visibility.
SYSTEM EVIDENCE
The original workbook now depends on a legacy desktop environment. The portfolio views below reproduce its analytical output from the workbook's own stored data and chart caches, with customer identities anonymized where applicable.
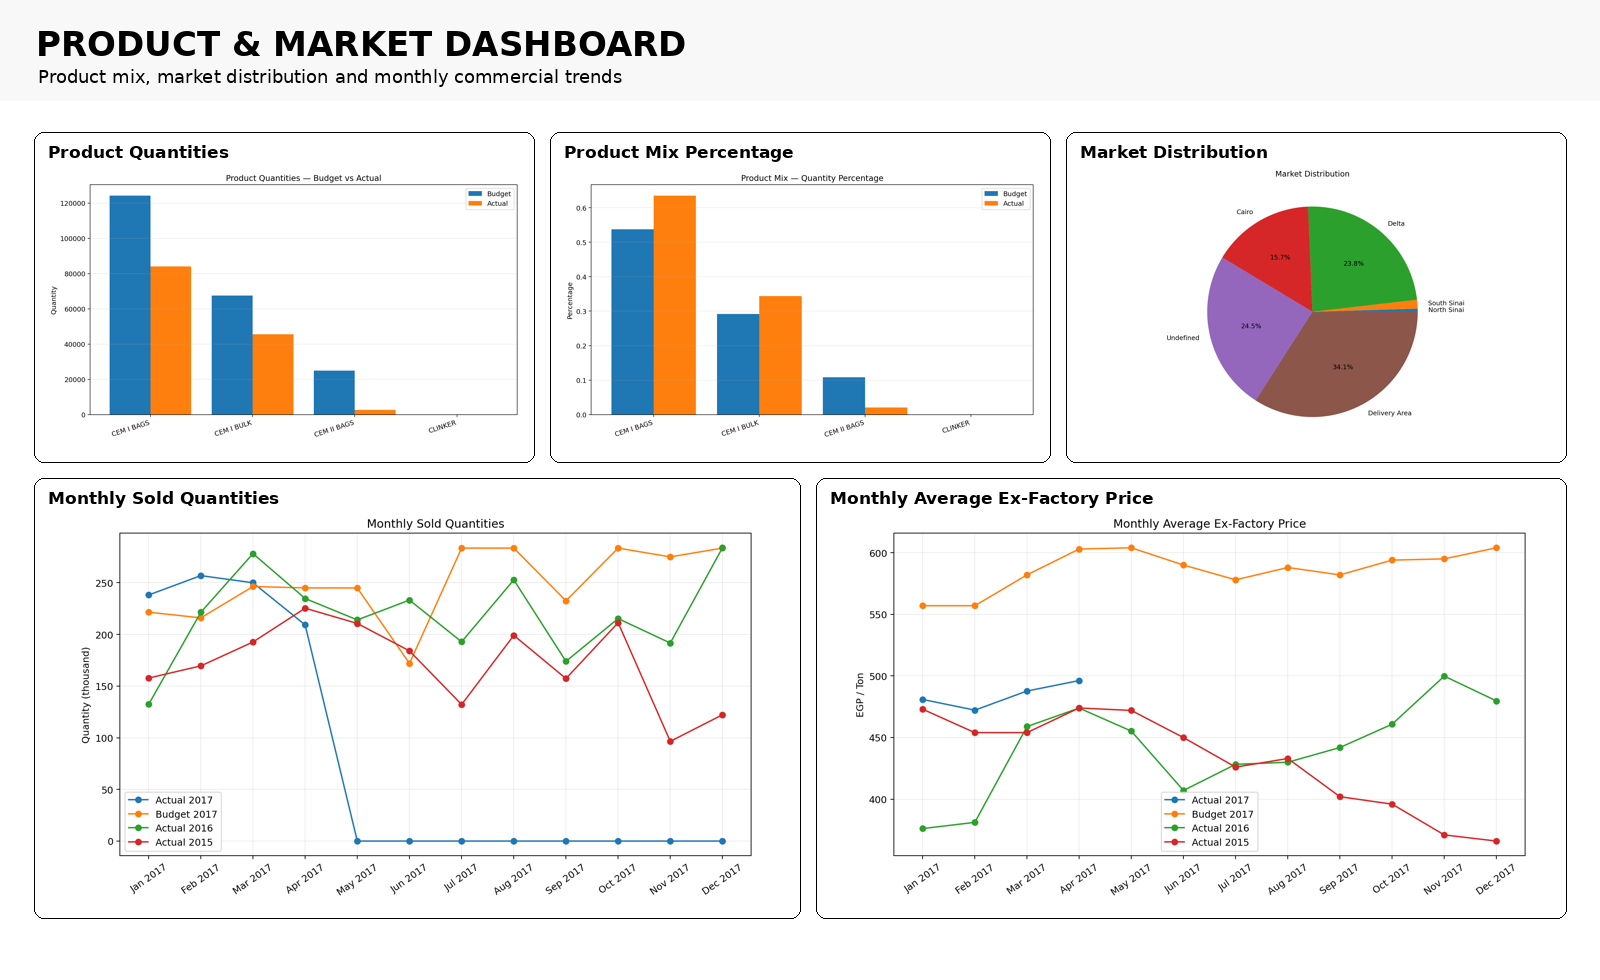
01 · ORIGINAL PRODUCT & MARKET VIEW
Commercial movement beyond total salesQuantity, product mix, market distribution and ex-factory price trends were part of the original operational reporting logic.Open full-size view ↗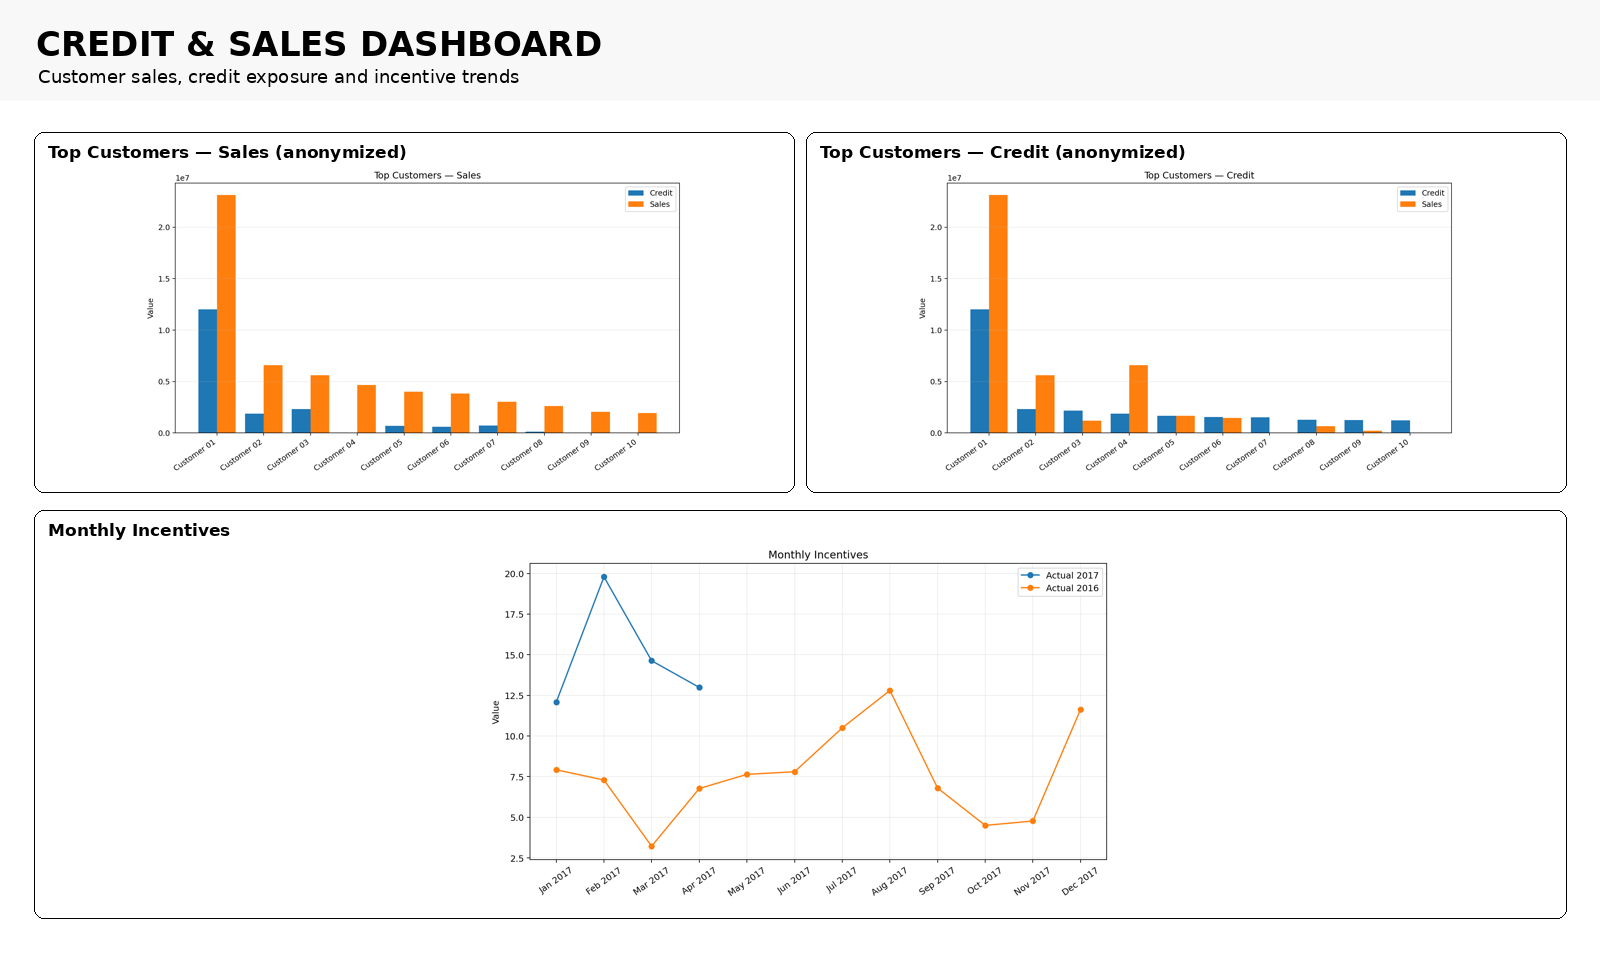
02 · ORIGINAL CREDIT & SALES VIEW
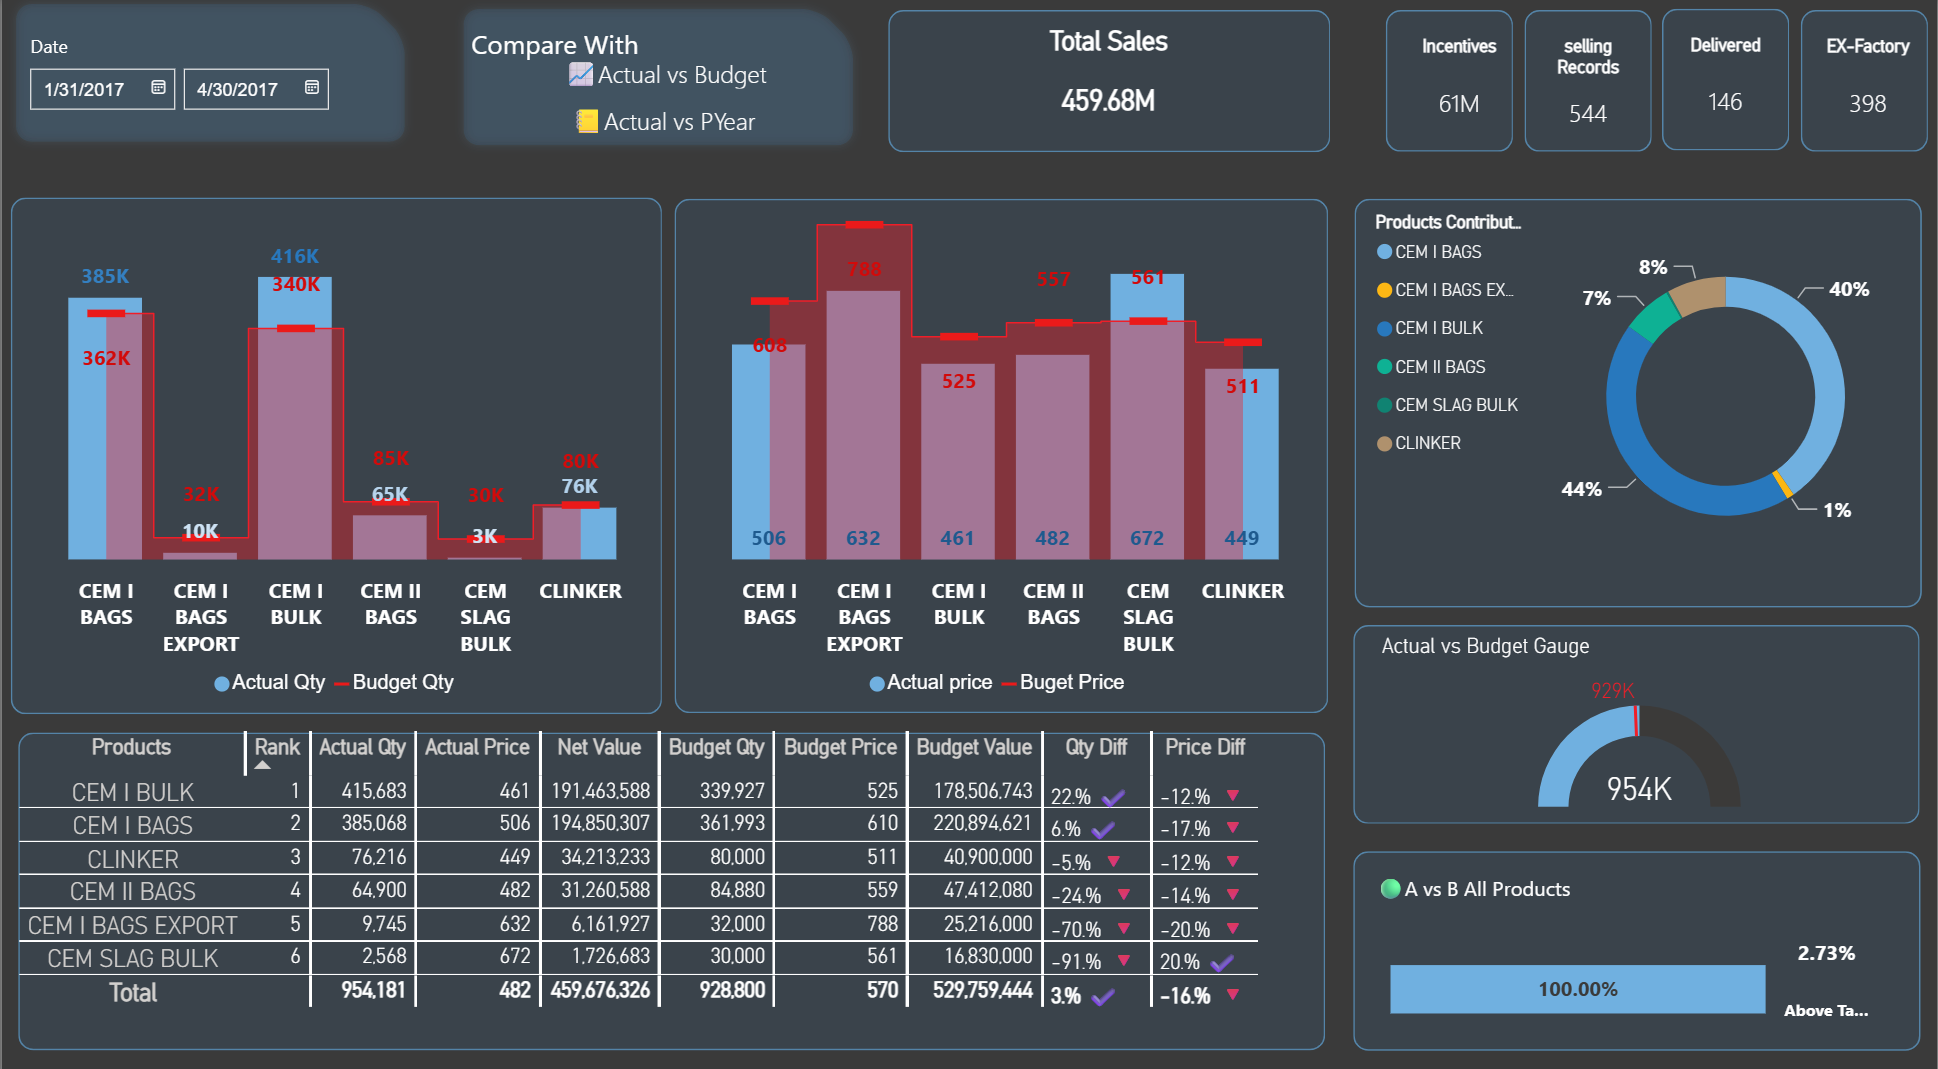
Customer performance and exposure togetherTop-customer sales, credit exposure and incentive trends connect commercial activity with the financial position of the account.Open full-size view ↗03 · POWER BI · ACTUAL VS BUDGET
Volume and price variance separatedThe modern model compares quantity and price independently against budget, then brings contribution and overall performance into the same review.Open full-size view ↗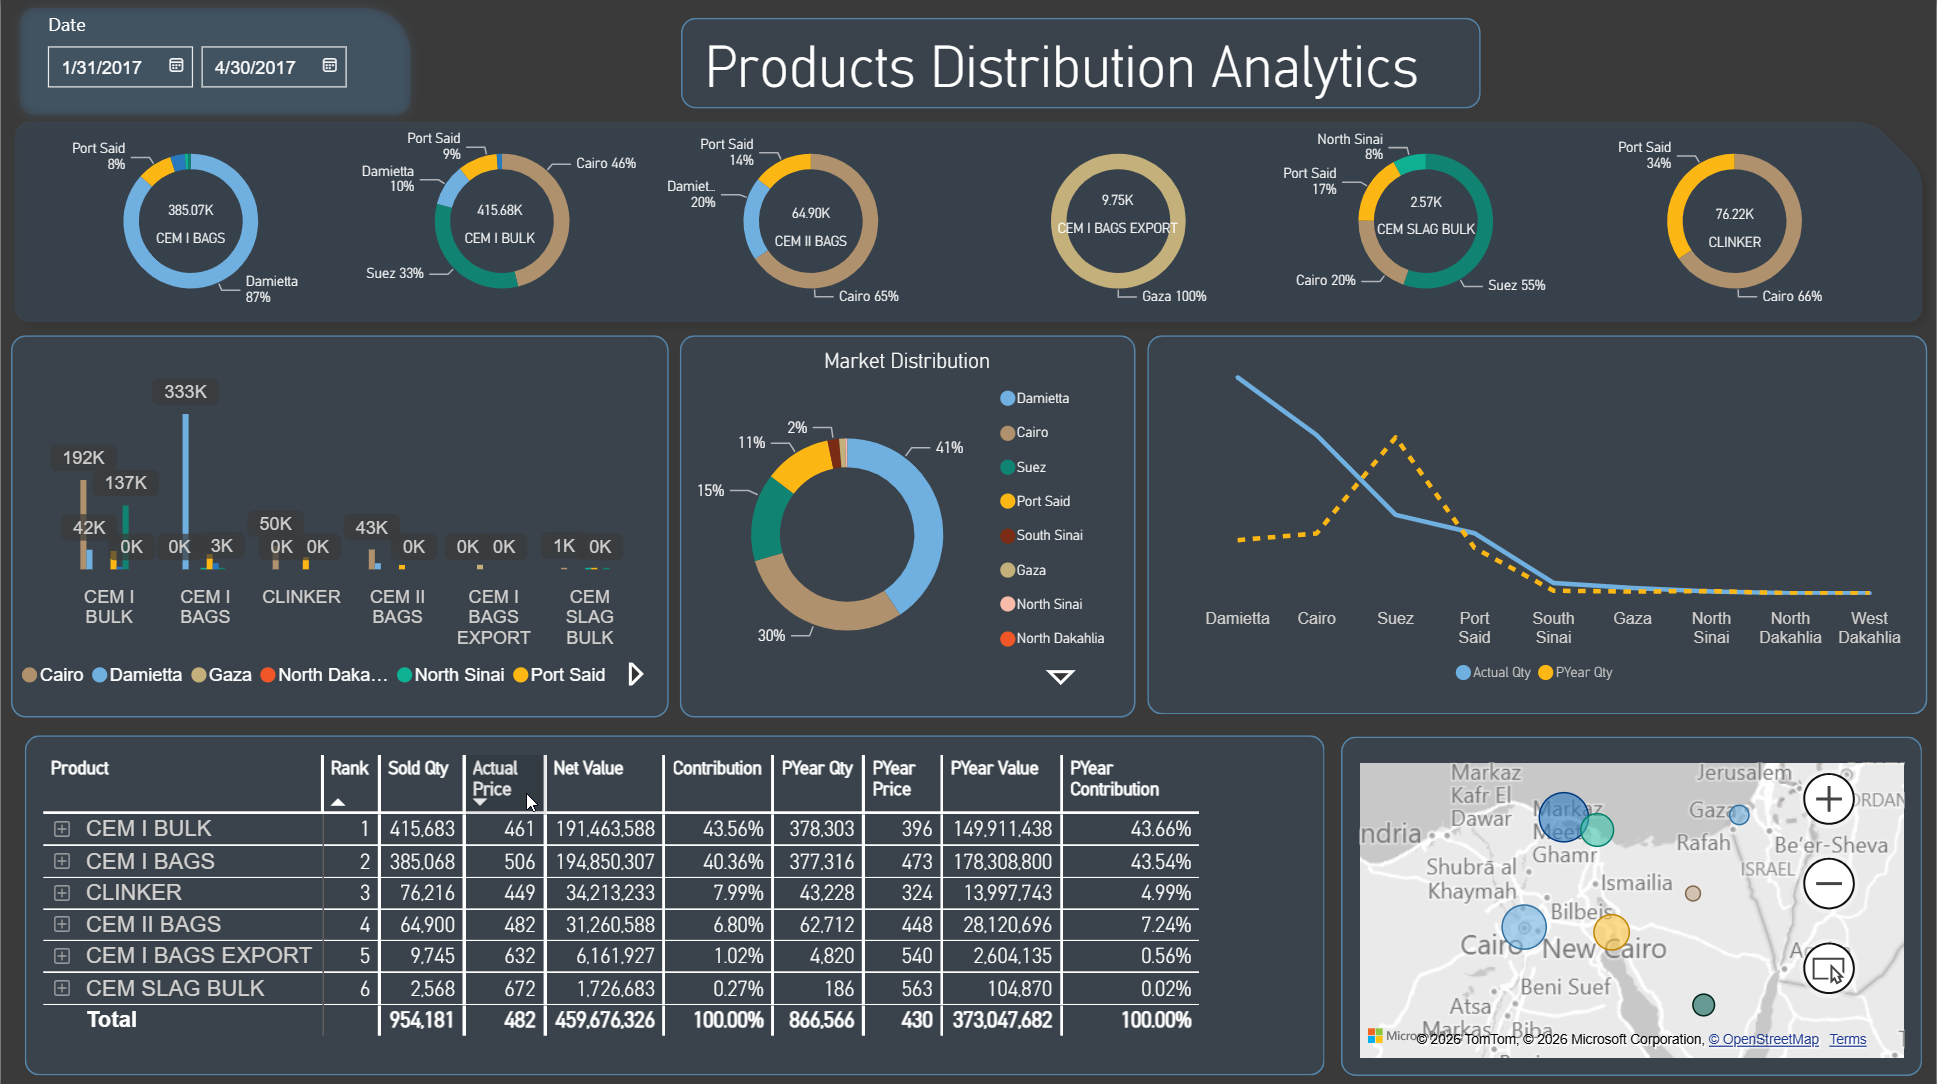
04 · POWER BI · PRODUCT DISTRIBUTION
Product and market concentration become visibleProduct contribution, geographic distribution and prior-year context make it easier to see where commercial performance is concentrated.Open full-size view ↗ANALYTICAL MODEL
The workbook and the later Power BI model both organize the same underlying questions: what sold, at what price, to whom, in which market, against which reference and with what commercial deductions or exposure.
Separate quantity movement from price movement so commercial performance is not reduced to one sales-value number.
Compare both quantity and price against budget, then expose the resulting variance by product.
Read current performance against historical movement to distinguish growth, mix changes and price effects.
Show product contribution and geographic distribution so volume concentration becomes visible.
Track customer sales, contribution, debit position and credit alongside transaction-level activity.
Bring incentives, freight and other commercial deductions into the path from gross value to net sales.
HOW IT WORKS
The workflow keeps customer, product and transaction detail underneath the management view so the result can be investigated rather than merely observed.
Bring sales, customer, product, dispatch, credit and budget records into one reporting structure.
Organize the workbook around shared dates, products, customers and commercial dimensions.
Calculate quantity, price, value, incentives, freight, contribution and customer-level measures.
Benchmark actual performance against budget and prior-year positions across products and markets.
Surface management views while keeping detailed customer and transaction analysis available underneath.
WHAT THE SYSTEM ENABLES
MY CONTRIBUTION
I designed and developed the original Excel/VBA reporting system around practical commercial requirements, including linked product, customer, sales, credit and pricing views. I later rebuilt selected analytics in Power BI to explore how the same commercial logic could be expressed through a modern data model and interactive reporting experience.
CASE STUDY 04
Operational commercial logic carried from Excel/VBA into modern analytical reporting.