Multiple performance dimensions
Delivery, capability, integration and operational workload needed to be read together rather than as disconnected reporting topics.
FEATURED CASE STUDY 03 · PERFORMANCE INTELLIGENCE
A two-layer analytics solution combining Power BI performance modeling with a Python operational dashboard, designed to turn KPI, capability, integration, delivery and workload data into clear management-ready views.
CONTEXT & ORIGIN
The reporting requirement covered delivery, capability, integration, outputs, workload and project progress. Each area carried its own measures, status logic and reporting rhythm, which made isolated charts easy to produce but a consistent performance picture much harder to build.
I structured the data and analytical logic so the information could be read at two levels: a Power BI management layer for KPI and performance visibility, and a Python operational layer for outputs, status, workload and detailed follow-up.
THE PERFORMANCE PROBLEM
The system was shaped around the questions behind the numbers: where performance stands, what the benchmark is, where the gap sits and which operating area explains it.
Delivery, capability, integration and operational workload needed to be read together rather than as disconnected reporting topics.
Current values only become meaningful when they are shown against targets, baselines and the remaining position.
Integration status had to show not only totals, but where engagement existed, where it was partial and where it had not started.
Management summaries still needed a clear path back to outputs, status, workload and detailed operating records.
PERFORMANCE INTELLIGENCE ARCHITECTURE
The solution separates source data, measurement logic and reporting layers so that the dashboard reflects a consistent model rather than a collection of unrelated visuals.
01 · SOURCE DATA
02 · PERFORMANCE MODEL
Normalize status and periods, relate the dimensions, calculate actuals, targets, baselines, gaps and progress.
03 · MANAGEMENT LAYER
04 · OPERATIONAL LAYER
SYSTEM EVIDENCE
The portfolio views below show the management and operational layers that were developed around the same performance-information problem.
01 · DELIVERY & EXECUTION
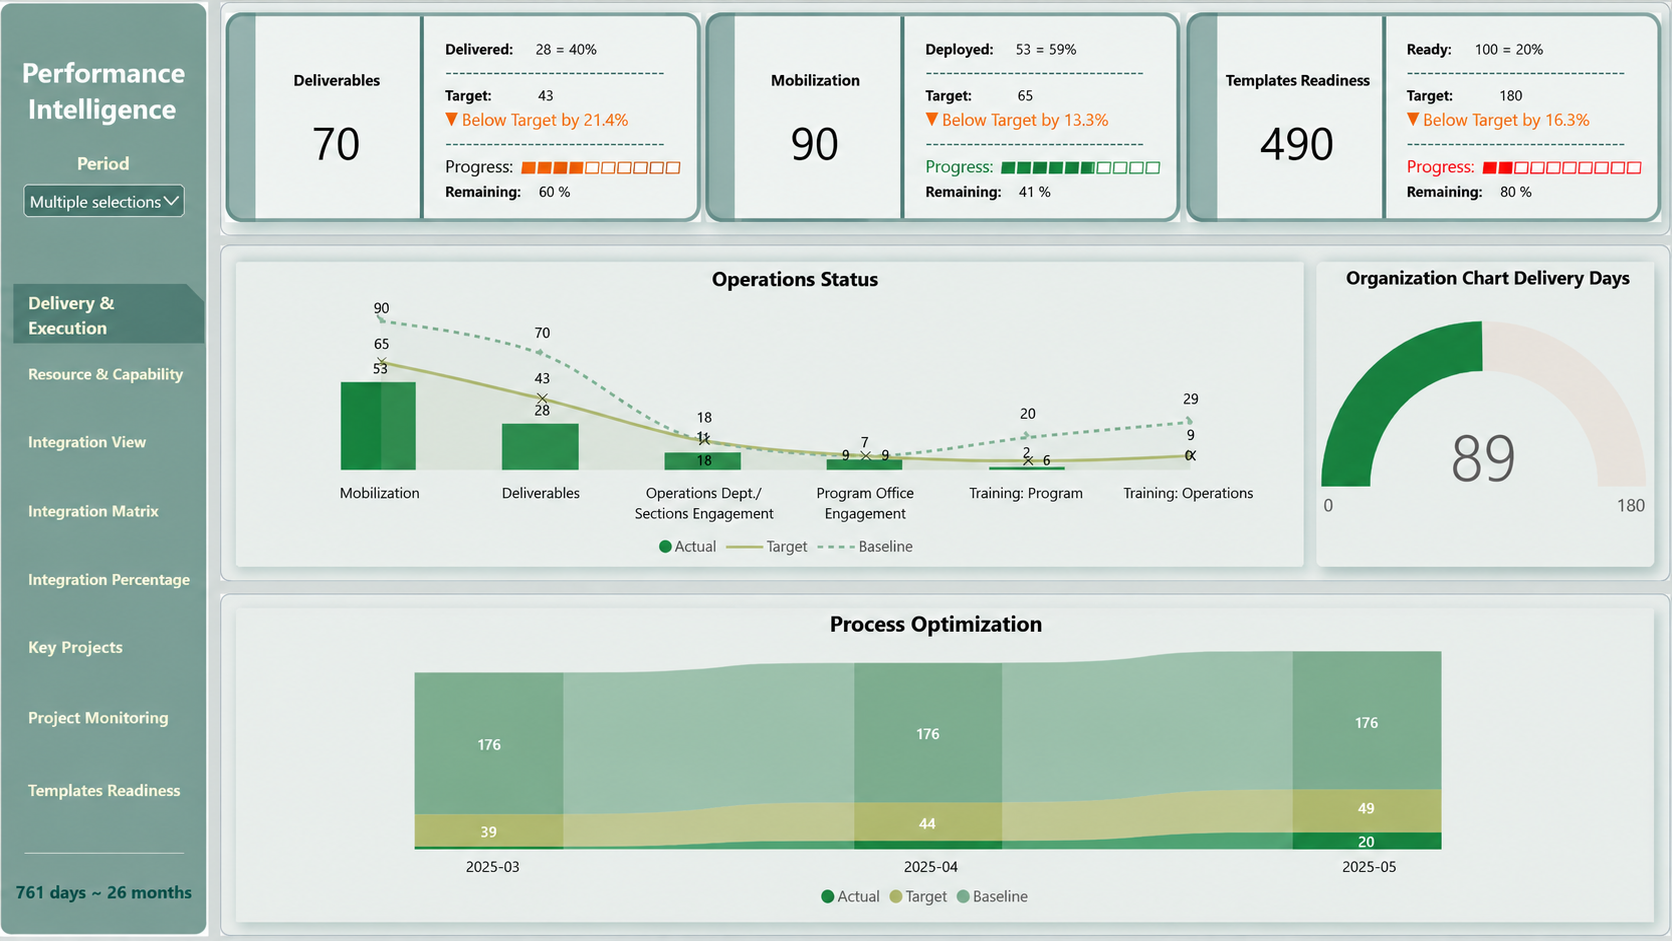
Actual, target and baseline in one viewTrack deliverables, mobilization, readiness and execution indicators while keeping the expected and starting positions visible.Open full-size view ↗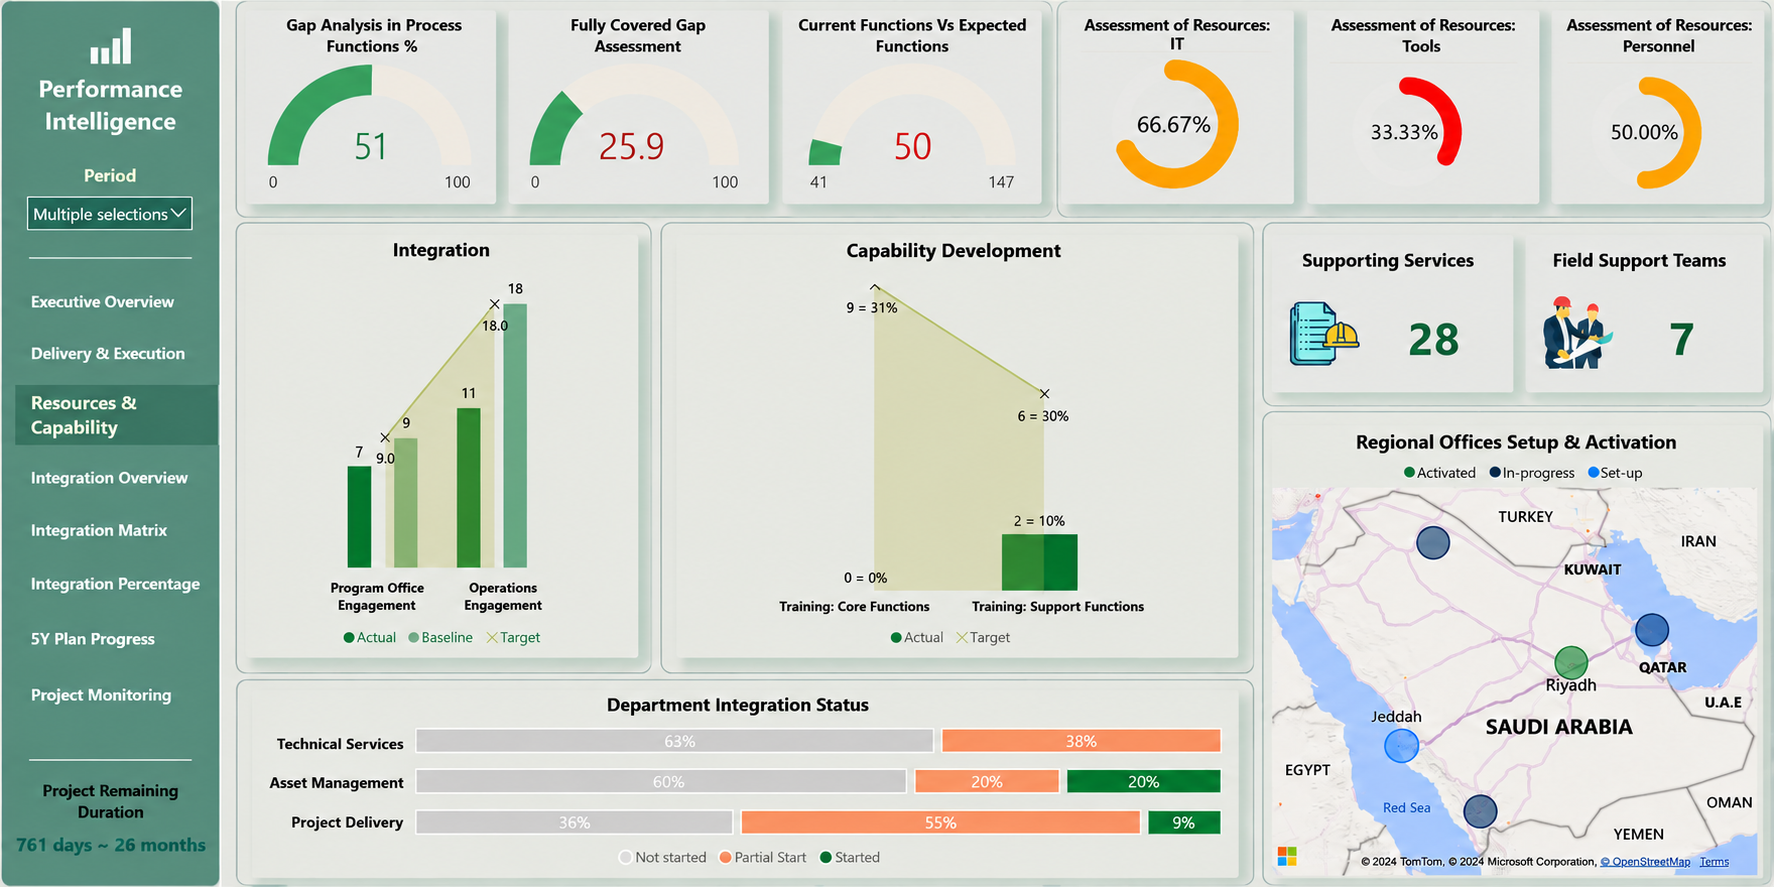
02 · RESOURCE & CAPABILITY
Capability gaps become measurableBring process-function coverage, resource assessment, training, regional setup and integration status into one analytical frame.Open full-size view ↗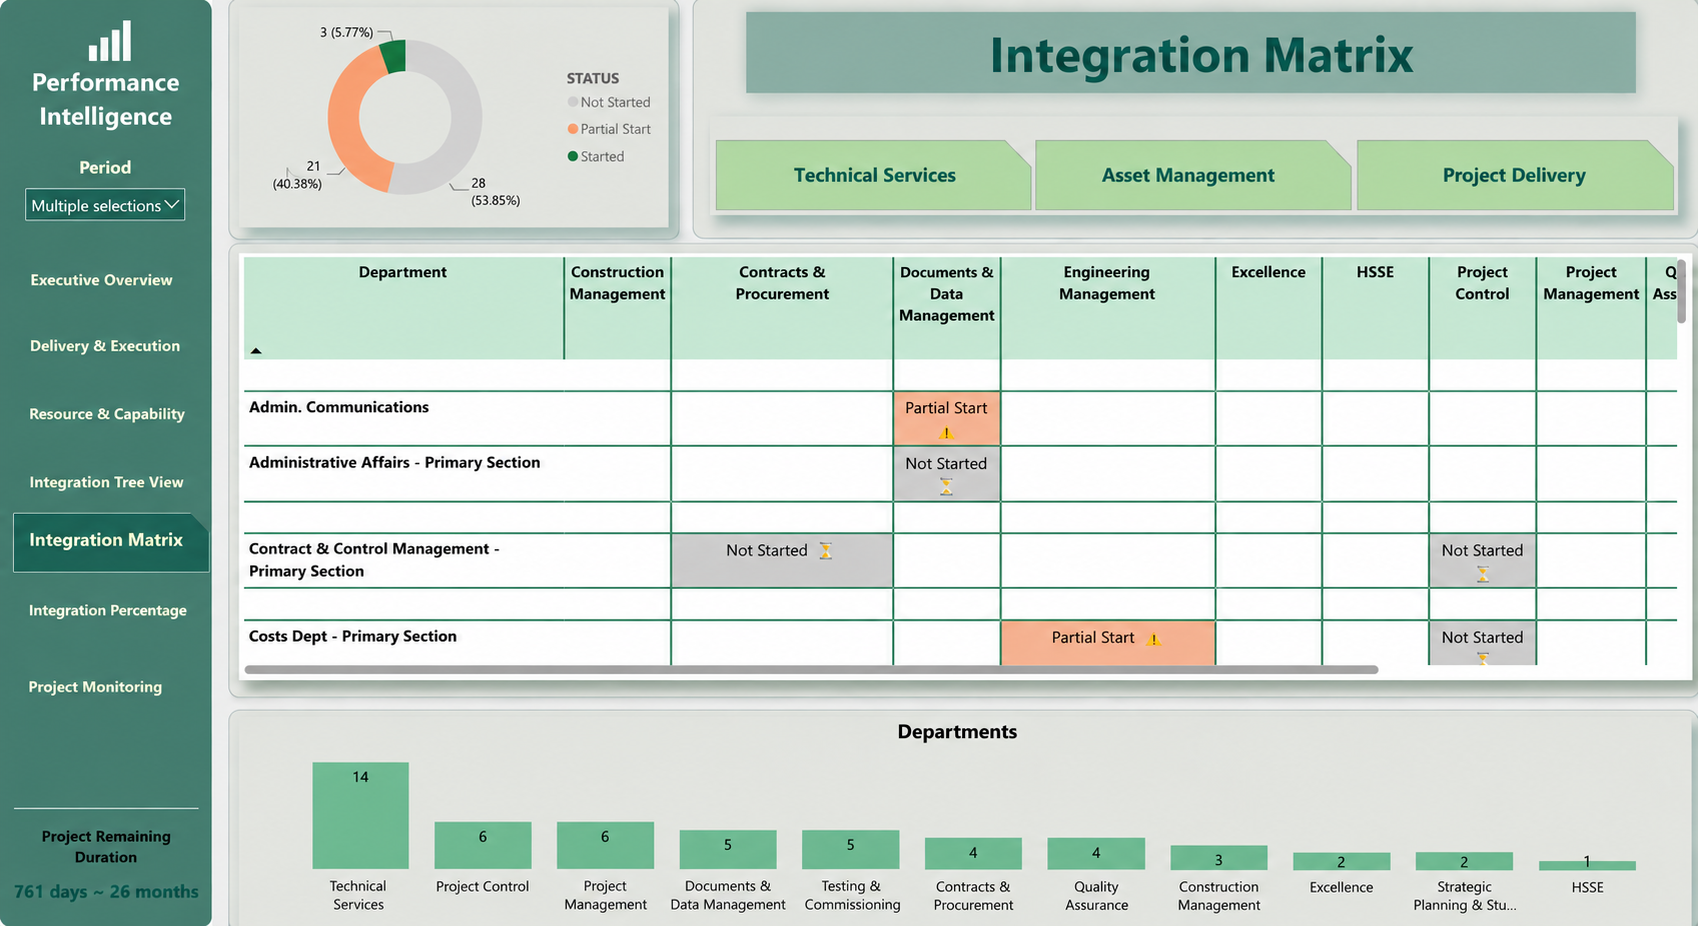
03 · INTEGRATION ANALYSIS
Cross-functional status, not just a percentageUse matrix-style analysis to expose where engagement has started, where it remains partial and where connection is still missing.Open full-size view ↗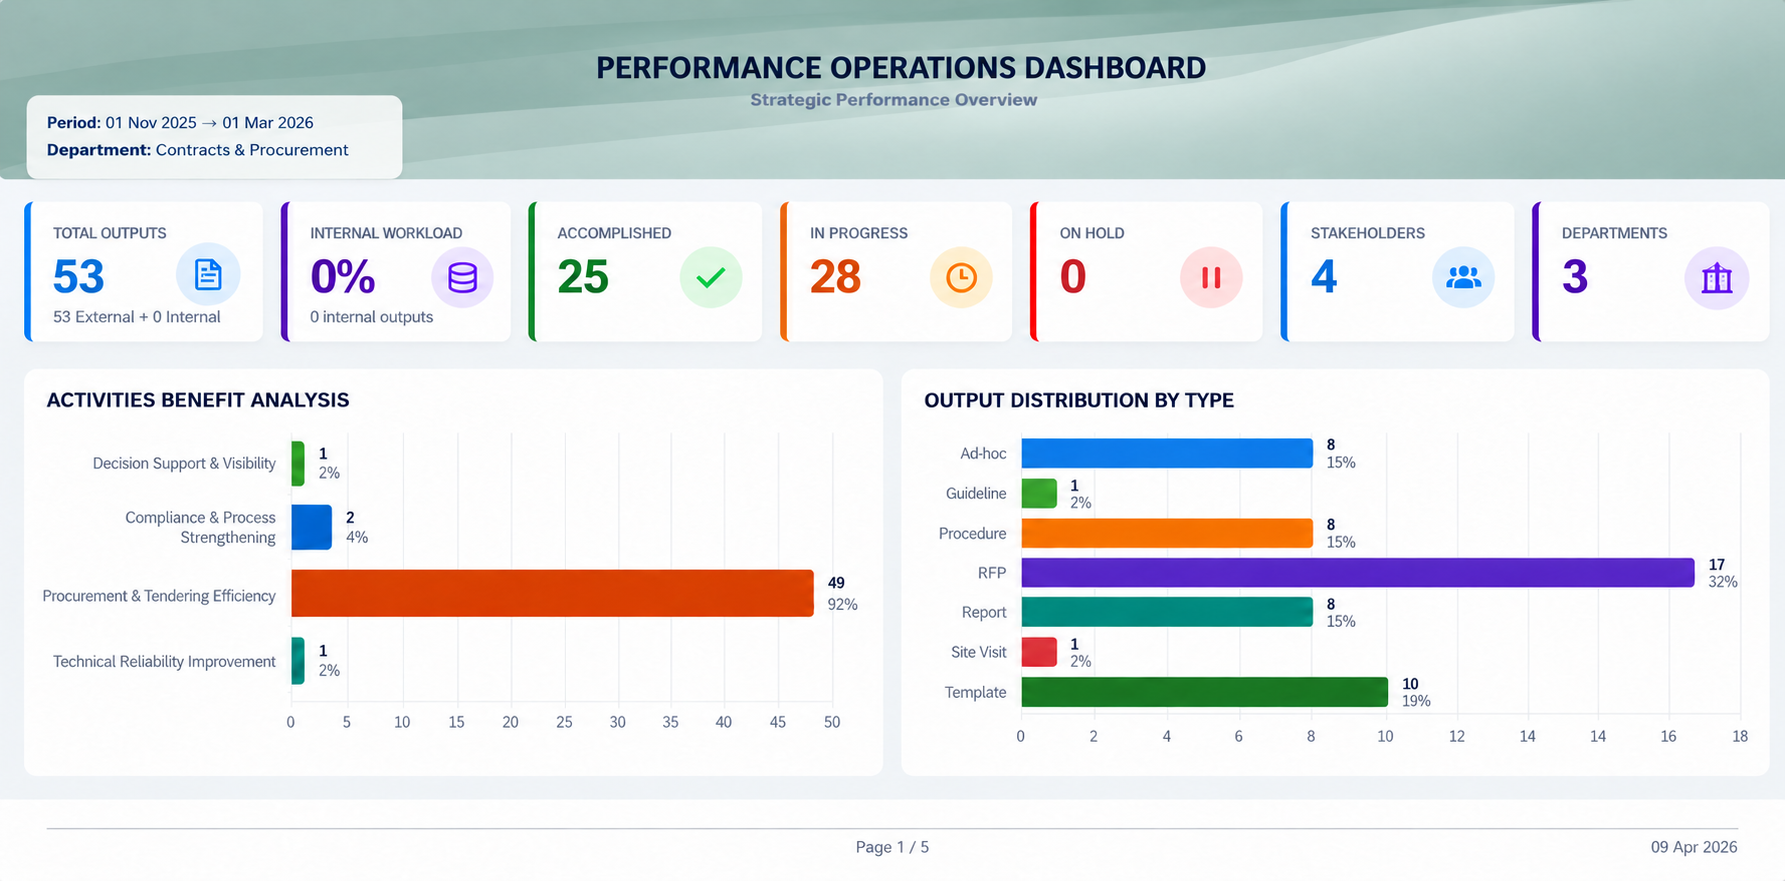
04 · OPERATIONAL FOLLOW-UP
The Python layer closes the loopTrack output status, activity trends and workload at operating level, with filtered data feeding a detailed follow-up environment.Open full-size view ↗ANALYTICAL MODEL
The model was designed to preserve context around each measure, then expose the gap between current position and expected performance.
Keep current performance visible against the expected position rather than showing actual values in isolation.
Retain the original benchmark so performance movement can be read against both target and starting point.
Translate capability and process assessments into visible areas of coverage, shortfall and remaining work.
Structure cross-functional engagement into matrix, percentage and progress views that reveal where connection is established or still incomplete.
Track deliverables, mobilization, readiness and other execution indicators through one consistent reporting model.
Complement executive views with output status, activity trends, workload and record-level detail in the Python layer.
HOW IT WORKS
The workflow keeps data structure and performance logic ahead of presentation, so every visual sits on a defined analytical purpose.
Organize performance, capability, integration and operational records into consistent analytical structures.
Define KPI logic around actuals, targets, baselines, completion and remaining position.
Expose gaps, progress, capability coverage and integration status instead of reporting isolated numbers.
Move between management-level performance views and detailed operational analysis.
Turn the resulting model into repeatable, decision-ready reporting in Power BI and Python.
WHAT THE SYSTEM ENABLES
MY CONTRIBUTION
I designed and developed the data structures, analytical logic, Power BI views and Python application shown in this case study. The work focused on turning a complex reporting requirement into a practical performance-information system rather than producing isolated dashboards.
CASE STUDY 03
Turning complex operational data into structured performance visibility.